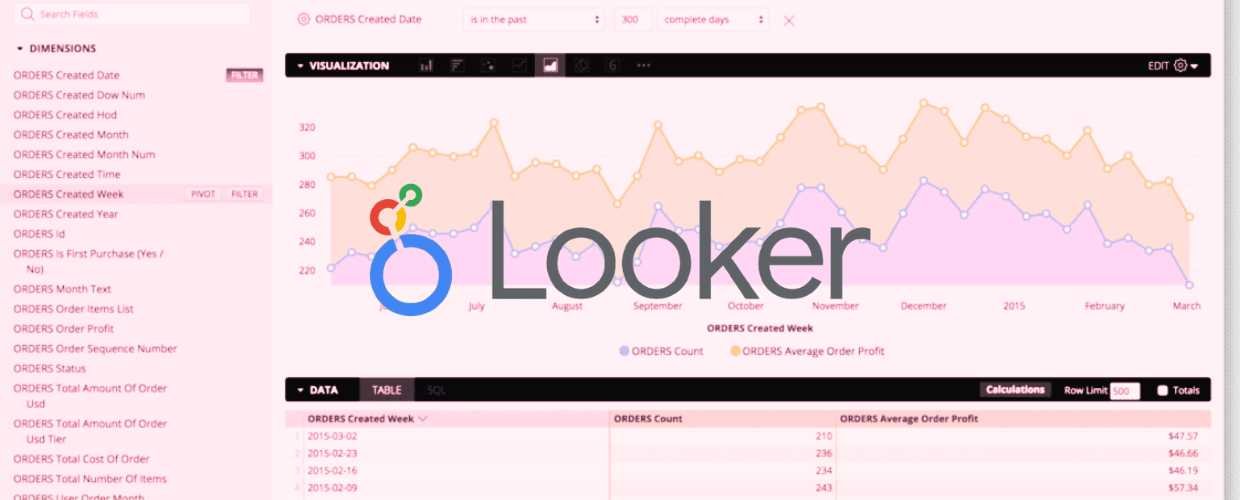
Looker helps teams break down data silos and make better-informed decisions by integrating data from various sources into a single view. With fresh and reliable data at their fingertips, everyone in the organization can access the insights they need to drive success.
Editorial Rating: 4.4/5.0
| Ease of use | 4.5 out of 5.0 |
| Functionality | 4.5 out of 5.0 |
| Integration and Deployment | 4.1 out of 5.0 |
| Customer Service and Support | 4.4 out of 5.0 |
| Product Performance | 4.5 out of 5.0 |
Likelihood to recommend 85%!
TECHGOLLY (TG) editorial team evaluates this data and contrasts the product with similar products on the market. Using a standard evaluation system or framework, they rate the product based on various criteria, including performance, ease of use, customer support, and overall quality against cost.
The platform receives mostly positive reviews from several user review platforms. According to SoftwateAnalytic experts’ recommendation, Looker achieved an overall 88%, indicating strong performance across multiple criteria. User reviews are also positive, with an average rating of 4.64 out of 5, indicating general user satisfaction. Users at the G2 review rate the platform at 4.4 out of 5, and Gartner Peer Insights rates it at 4.4 out of 5.
Looker Overview
As a cloud-based business intelligence (BI) platform, Looker (now part of Google Cloud) is designed to help businesses explore and analyze data from various sources to make data-driven decisions. With the BI solution, business teams can analyze their supply chains, market digitally, quantify customer value, interpret customer behavior, and evaluate distribution processes. The solution also allows users to view the source of the data they are analyzing to understand how the data is being manipulated.
Looker’s dashboards offer customizable charts, graphs, and reports to present data and insights. Users can drill down into the data to discover information in multiple layers. Its data modeling language allows users to define metrics and explore relationships between data sets. The storytelling feature enables users to present data analysis to stakeholders through data-rich visualizations. Looker is widely used across various industry sectors in the US and Canada, including e-commerce, construction, education, finance, healthcare, media, and technology. The platform is a game-changing data analytics solution for companies looking to improve their business intelligence and data visualization.
Key Features of Looker
| Reports | Reports Interface Steps to Answer Graphs and Charts Score Cards Dashboards |
| Self Service | Calculated Fields Data Column Filtering Data Discovery Collaboration / Workflow Automodeling |
| Advanced Analytics | Predictive Analytics Data Visualization Big Data Services |
| Data Modeling and Blending | Data Filtering |
Conclusion
Looker is a powerful and versatile business intelligence platform that offers comprehensive data integration, analysis, and visualization capabilities. Its ability to break down data silos and present data in a meaningful way helps organizations make informed decisions and drive success. With strong expert recommendations and positive user feedback, Looker has earned high ratings for its features, ease of use, and value. Its extensive use across various industries and robust functionality position Looker as a leading solution for companies looking to enhance their data-driven decision-making and business intelligence strategies.


