

The American economy is currently displaying a bizarre, double-sided reality that has left academic economists, policymakers, and Wall Street analysts deeply confused. If you look at the hard, objective economic data, the United States is experiencing a highly robust economic cycle. Gross Domestic Product is growing at a healthy annualized rate between 2.7% and 4.3%. Corporate earnings are booming, with an 84% beat rate on the S&P 500 and overall corporate profit growth tracking at a stellar 27%. Initial jobless claims remain remarkably low at 209,000, and the unemployment rate sits near a historic cycle-low of 4.3%.
Yet, if you look at the consumer sentiment surveys that have historically served as the definitive gauge of the public mood, the country appears to be stuck in a deep, dark economic depression. The University of Michigan’s Index of Consumer Sentiment registered a dismal reading of 44.8 in May, before staging a modest 10.5% recovery to 49.5 in June. Despite this minor uptick, these scores remain near the worst levels recorded since the survey began in 1952. They are lower than the index levels printed during the depths of the 2008 Great Recession, the 1980 hyperinflation crisis, and the 2020 pandemic lockdowns.
This staggering disconnect has triggered a fierce debate across the financial world. Are Americans genuinely experiencing a lousy, high-stress economy, or has the country’s most prestigious consumer sentiment survey simply broken down? The evidence increasingly points to the latter. A combination of a massive methodological overhaul, deep partisan political bias, and a fundamental misunderstanding of inflation metrics has structurally broken the historical relationship between reported sentiment and actual consumer behavior. While consumers tell researchers they feel absolutely miserable, they continue to shop, travel, and spend money at record rates, rendering legacy confidence surveys increasingly useless as leading indicators of economic activity.
The Great Disconnect: Booming Retail Registers vs. Great Depression Sentiment
For decades, consumer sentiment surveys operated under a simple, reliable economic premise: when people feel secure about their jobs, their incomes, and the state of the nation, they report high confidence levels and spend more money. When they feel anxious, confidence drops, and they pull back on non-essential spending to build up their personal savings. This predictable relationship made sentiment surveys a vital tool for central bankers and retail executives trying to forecast future consumer demand, which drives roughly two-thirds of U.S. gross domestic product.
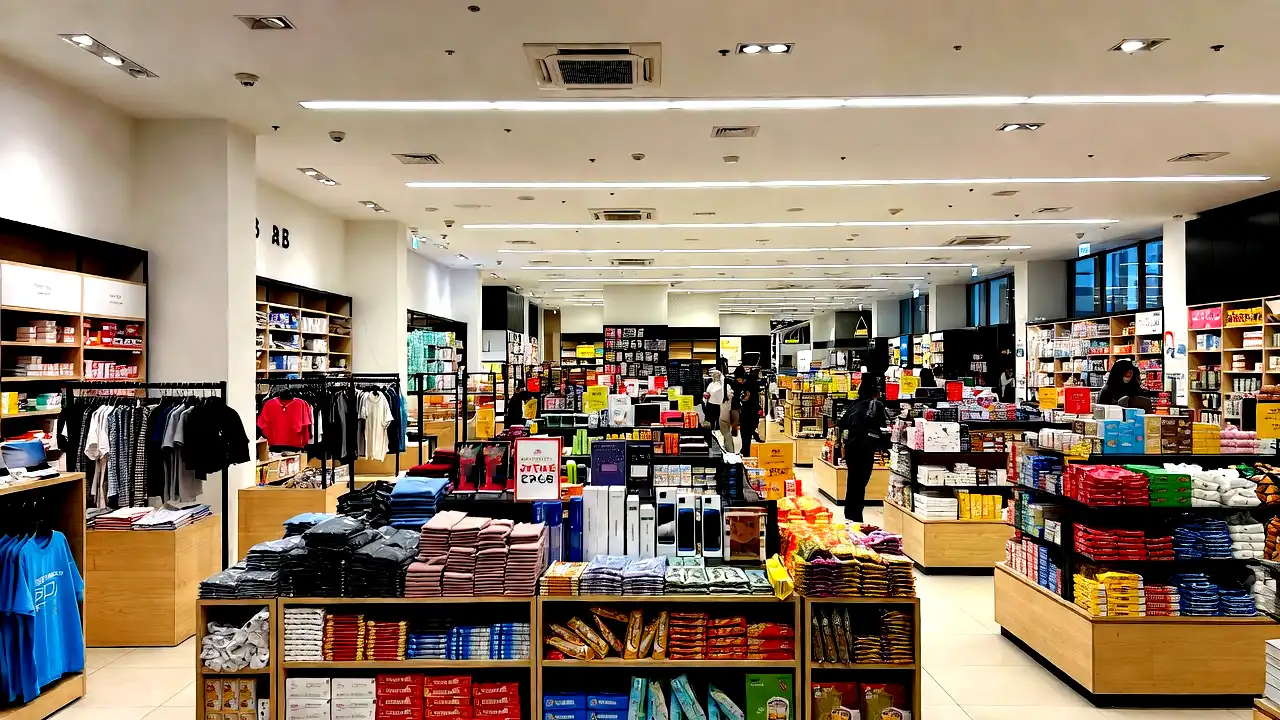
Today, this historical relationship has completely collapsed. The deep pessimism captured by the University of Michigan survey is entirely contradicted by the hard, observed behavior of the American consumer. Despite reporting sentiment scores consistent with a severe financial collapse, consumers are spending money at a blistering pace. Retail sales rose 0.5% in April and are running a healthy 4.9% above year-ago levels.
This dramatic mismatch between what consumers say and what they actually do with their wallets has created a massive “vibecession”—a state where the public economic vibe is profoundly negative, but the physical economic engine continues to hum along at full speed. This gap suggests that sentiment surveys are no longer capturing objective financial stress. Instead, they have transformed into a sounding board for general social, political, and cultural anxiety, making them highly unreliable guides for quantitative economic modeling.
The Methodological Reset: The Hidden Toll of the Web Transition
The primary reason why the University of Michigan’s Consumer Sentiment Index has drifted so far from economic reality involves a quiet, highly significant change in how the research team collects its data. Since its creation in 1946 by pioneering psychologist George Katona, the Surveys of Consumers routinely updated its methods to keep pace with communication trends.
The most disruptive change occurred between April and July of 2024, when the University of Michigan completely phased out its traditional telephone-based interviewing system. For decades, the survey relied on Computer-Assisted Telephone Interviewing (CATI) using cellular random-digit dialing, targeting roughly 600 highly structured interviews per month. In 2024, the program transitioned entirely to a web-based, self-administered data collection model using address-based sampling, expanding its monthly target sample size to between 900 and 1,000 respondents.
While the research team designed this transition to improve demographic coverage and lower operational costs, the change in survey mode introduced a profound, artificial bias into the historical dataset. Extensive academic research has long demonstrated that people respond very differently when typing answers on an anonymous computer screen compared to speaking directly with a human interviewer over the phone. This shift in response behavior has created a major structural break in the sentiment series, making modern scores completely non-comparable to the scores recorded in previous decades.
The Psychology of Anonymity: Phone Interviews vs. Web Screens
The psychological difference between phone and web surveys centers on a phenomenon known as social desirability bias. When an individual speaks to a live human interviewer over the telephone, they are naturally inclined to present themselves in a positive, successful light. People are hesitant to admit to a stranger that they are struggling financially, or that they feel deeply pessimistic about their personal prospects. This subconscious desire to sound prosperous and socially desirable creates a natural upward bias in phone-based sentiment surveys.
When that same respondent sits alone in front of a web browser, the human element disappears. The anonymous digital screen acts as an emotional release valve, allowing individuals to express their rawest, most unfiltered anxieties, frustrations, and political complaints.
A statistical analysis published by former White House economists Ryan Cummings and Ernie Tedeschi confirmed the scale of this mode effect. They documented that the methodological shift from telephone to online interviewing resulted in an artificial, systemic reduction of approximately 8.9 index points—or more than 11%—in the overall sentiment score. This means that if the University of Michigan were still conducting its surveys via telephone today, the June sentiment reading would sit closer to 58 rather than the dismal 49.5, instantly removing the highly sensational “worse than the Great Recession” label.
The Demographic Sampling Shift and Non-Response Bias
The transition to web-based interviewing also fundamentally altered the demographic composition of the survey respondents. Phone-based random-digit dialing, while increasingly difficult to execute due to low call-response rates, did a relatively decent job of reaching a random cross-section of the American population.
Web-based surveys using address-based sampling, however, are highly vulnerable to self-selection and non-response bias. Individuals who take the time to fill out long, online questionnaires are systematically different from those who ignore them. They tend to be older, more politically engaged, and more highly opinionated than the general population.
Statistical audits of the post-transition survey assignments revealed that online respondents were twice as likely to belong to the 65-and-over age cohort compared to younger, fast-moving demographics. Because older Americans on fixed retirement incomes feel the impact of price increases far more acutely than younger, career-advancing professionals enjoying double-digit wage gains in the AI-fueled tech sector, oversampling this demographic has artificially dragged the overall sentiment index downward.
The Partisan Filter: When Economic Sentiment Becomes a Political Statement
The second systemic issue breaking the consumer sentiment index is the extreme polarization of American politics. In modern public life, opinions on the national economy have largely ceased to be objective assessments of personal finance. Instead, they have transformed into highly defensive political statements, serving as a team jersey that respondents wear to signal their support or opposition to the political party currently occupying the White House.
This partisan bias has severely distorted the integrity of the data. Economic tracking polls show that the single largest predictor of a respondent’s economic sentiment is which political party controls the presidency.
When a Democrat is in the White House, registered Democrats report highly optimistic sentiment scores, while Republicans report scores consistent with a severe economic collapse, regardless of their actual income, employment status, or household net worth. When a Republican wins the presidency, the exact opposite occurs, with the two lines immediately trading places in a massive, overnight shift.
The “Vibecession” and the Presidential Lens
This partisan polarization is particularly visible when looking at the underlying data of the University of Michigan survey. In the summer of 2024, the complete transition to the web-based survey coincided with a significant drop in the proportion of Republican respondents and a corresponding rise in the share of highly vocal, politically engaged Democratic and Independent respondents.
If the relative shares of political party affiliation had remained at their early 2024 levels, the overall sentiment index would be at least 7 points higher today. This distortion highlights the danger of relying on subjective surveys for objective economic planning.
When a survey measures political anger rather than actual purchasing power, it ceases to function as an economic indicator. Bank of America’s research into this phenomenon showed that long-term inflation expectations among Democrats and Independents regularly diverge by up to 3.6 percentage points from the expectations of Republicans, proving that respondents are using inflation estimates as a weapon to grade the performance of the current administration rather than reflecting real-world price dynamics.
The Sticker Shock Reality: Inflation Cooling vs. Cumulative Price Gaps
While methodological shifts and political bias explain a significant portion of the sentiment disconnect, there is also a genuine, psychological reason why consumers feel anxious about their finances. This anxiety stems from a fundamental difference in how academic economists and real-world consumers define and experience “inflation.”
To an academic economist or a Federal Reserve official, inflation is a rate of change. When they declare that inflation has successfully “cooled” from its peak of 9.1% down to 3% or 4.6% following recent Middle East energy disruptions, they are celebrating a slower rate of price increases. They view this cooling as a major victory, suggesting that the economy is returning to a stable, healthy baseline.
To the average consumer, however, this academic distinction is completely irrelevant. Consumers do not experience the rate of change; they experience the absolute, cumulative price level. When inflation cools from 9% to 3%, prices do not drop—they simply rise more slowly on top of an already highly elevated base.
Since the start of the decade, the cumulative cost of living in the United States has increased by an estimated 20% to 25%, with essential categories like groceries, transportation, and electricity experiencing even larger increases. When a shopper visits the grocery store, they are still paying 25% more for a gallon of milk or a loaf of bread than they did a few years ago. This permanent, structural step-up in the cost of basic survival creates a constant, grinding sense of financial exhaustion, even if the rate of inflation is technically declining.
The Housing and Interest Rate Lockout
The pain of this cumulative price increase is particularly acute in the housing market, which serves as the traditional foundation of the American middle-class dream. To combat high inflation, the Federal Reserve raised interest rates at the fastest pace in forty years, pushing 30-year fixed mortgage rates into the mid-6% to high-6% range.
This rapid rise in borrowing costs has created a severe affordability crisis. Homebuilders have seen their operating margins squeezed from 20% down to 11% as they offer expensive mortgage rate buy-downs and price concessions to attract buyers.
For the average consumer, the combination of high home prices and high mortgage rates has made buying a home nearly impossible. Anyone looking to purchase their first home feels completely locked out of the market, generating a deep sense of economic resentment.
Even if their current wages are rising and their employment is secure, the inability to participate in the housing market creates a persistent psychological gloom that colors every response they give to consumer surveys.
What Consumers Do vs. What Consumers Say: The Uselessness of Sentiment
The decoupling of consumer sentiment from actual spending behavior has profound implications for the financial industry. For decades, quantitative hedge funds, algorithmic trading models, and macroeconomic researchers relied on the University of Michigan index as a primary input for their asset allocation strategies. A declining sentiment index was viewed as a reliable leading signal to reduce exposure to retail stocks, industrial manufacturers, and consumer discretionary sectors.
Today, using this legacy playbook is a recipe for severe financial underperformance. Quantitative models that sold off consumer-facing equities based on dismal sentiment prints missed out on a massive, highly lucrative stock market rally.
As a result, leading investment management firms are starting to completely ignore subjective sentiment surveys. Instead, they are redirecting their resources toward real-time, behavioral alternative data, such as credit card transaction registries, anonymized mobile phone location data in retail districts, and airline booking volumes. These objective, behavioral metrics show that despite their verbal complaints, consumers are continuing to spend money at a historic pace, rendering verbal confidence gauges increasingly obsolete.
This shift represents a healthy, necessary evolution in economic measurement. In a highly polarized, media-saturated society, asking individuals how they “feel” about the economy is more likely to capture their media consumption habits and political grievances than their actual financial health.
By prioritizing what consumers do over what consumers say, financial analysts can build a much more accurate, objective picture of the national economy. The broken nature of modern consumer surveys is not a sign of economic decline; rather, it is a call for better, more sophisticated tools that measure the physical reality of commerce rather than the volatile, easily manipulated vibes of the public square.