
In the rapidly evolving digital landscape of modern business, raw data has become the most valuable currency an organization can possess. However, collecting massive amounts of customer information, sales metrics, and operational statistics is entirely useless if your team cannot effectively interpret or understand what that data actually means. Many companies struggle with siloed information, spending countless frustrating hours manually compiling static spreadsheets that instantly become outdated the moment they are printed. To successfully survive and thrive in today’s highly competitive corporate environment, businesses absolutely need dynamic, real-time analytics platforms that bridge the massive gap between raw numbers and actionable strategic insights.
Enter Microsoft Power BI, an absolute titan in the rapidly expanding business intelligence and data visualization software category. Designed to seamlessly connect disparate data sources and transform them into interactive, visually stunning dashboards, this platform promises to democratize data science for everyday business users. In this extensive, highly detailed, and SEO-friendly product review, we will meticulously examine every single operational aspect of Microsoft Power BI. We will explore its incredibly robust core capabilities, seamless software integrations, and overall financial value to help you determine whether it is the perfect analytical solution for your growing company.
What is Microsoft Power BI?
Microsoft Power BI is a robust business analytics service designed to transform raw, unstructured data into visually appealing and interactive digital dashboards.
This highly sophisticated software empowers organizations to make data-driven decisions by providing real-time insights across various interconnected business departments.
- Power BI Desktop: A powerful, free local application utilized extensively for complex data modeling, transformation, and initial report authoring.
- Power BI Service: The cloud-based digital portal where completed reports are securely published, widely shared, and collaboratively analyzed by teams.
- Power BI Mobile: Dedicated smartphone applications that allow busy traveling executives to view live corporate dashboards on the go securely.
- Report Server: An on-premises enterprise server solution specifically designed for strict organizations that cannot legally store sensitive data in the cloud.
Unlike basic spreadsheet applications that constantly crash under the weight of massive datasets, this platform is engineered to handle millions of rows of data with ease. Microsoft’s incredibly powerful proprietary data compression algorithms enable regular desktop computers to smoothly process massive enterprise-grade datasets. This fundamental architecture ensures that users can drag, drop, and drill down into highly complex visualizations without experiencing frustrating software lag or continuous system crashes.
Key Features of Microsoft Power BI
Understanding the core capabilities of this analytics platform is essential for businesses looking to upgrade their data visualization strategies.
The following standout technical features perfectly highlight exactly why this software heavily dominates the modern business intelligence market today.
- Comprehensive Data Connectivity: Natively connects to hundreds of diverse data sources, including Excel, Google Analytics, Salesforce, and large-scale Azure SQL databases.
- Power Query Editor: A deeply intuitive data transformation tool that allows users to easily clean, merge, and heavily filter messy datasets before visualization.
- DAX Language Support: Utilizes Data Analysis Expressions to flawlessly create incredibly complex custom calculations and highly sophisticated time-intelligence metrics.
- Artificial Intelligence Insights: Employs built-in machine learning algorithms to automatically identify hidden data trends, analyze text sentiment, and forecast future sales.
Advanced Data Modeling and Visualization
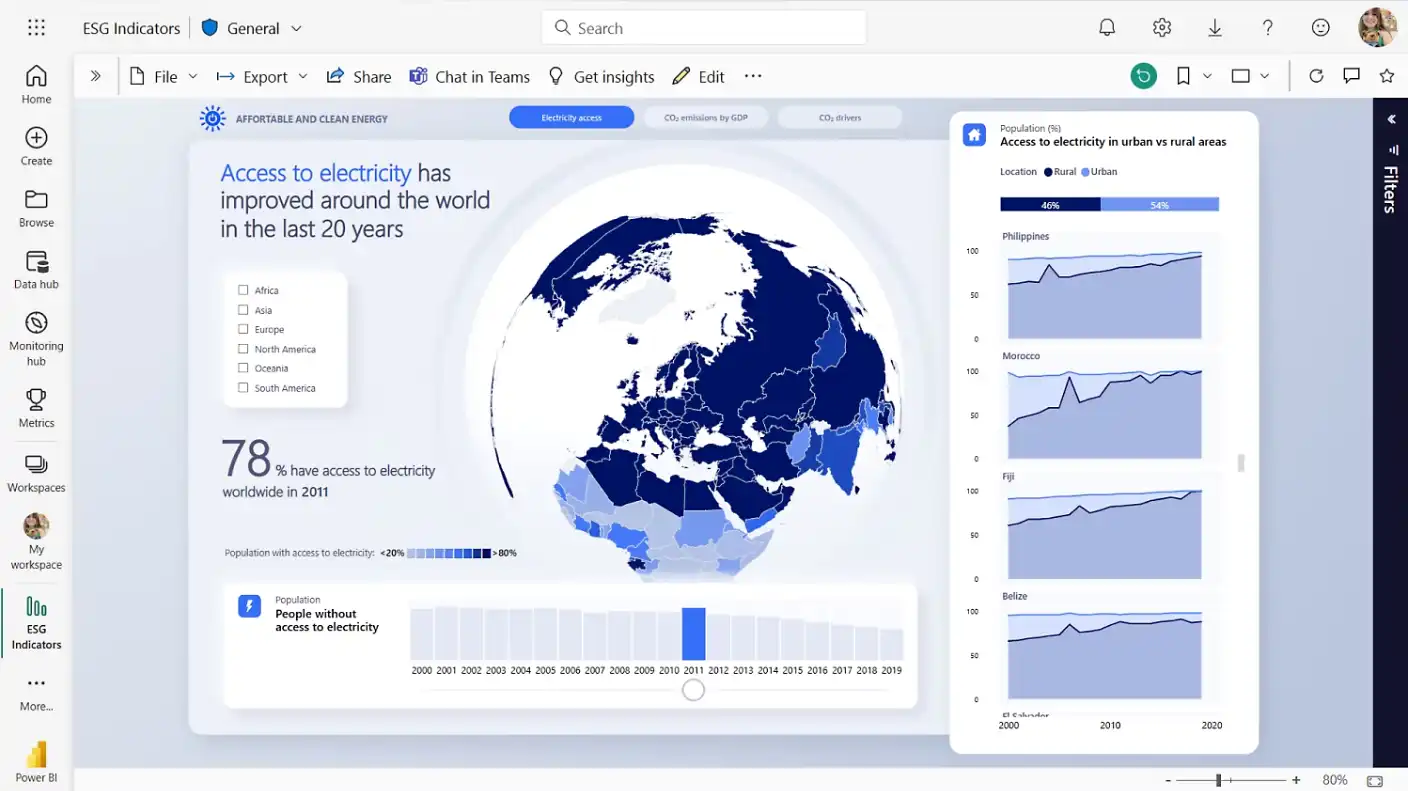
The true magic of this platform lies entirely within its highly sophisticated data modeling capabilities and vast library of visual representations. Users are not limited to basic bar charts or standard pie charts when trying to tell a compelling story with their corporate metrics. The platform offers an extensive marketplace featuring hundreds of custom-built visuals, ranging from complex interactive maps and geographic heat maps to detailed network relationship charts.
Furthermore, the data modeling engine allows users to establish highly complex relationships between completely different data tables easily. You can seamlessly link a daily sales table to a geographical region table, allowing your customized interactive dashboard to instantly filter total global revenue by clicking a specific country on a digital map. This highly dynamic interactivity empowers everyday business users to ask spontaneous questions during critical board meetings and instantly receive accurate visual answers.
Seamless Microsoft Ecosystem Integration
For organizations already deeply invested in the broader Microsoft software ecosystem, choosing this specific analytics platform is an absolute no-brainer. The software integrates seamlessly with popular daily applications like Microsoft Excel, allowing users to quickly export summarized dashboard data back into a familiar spreadsheet format for localized analysis. This highly comfortable integration drastically reduces the initial friction often associated with adopting entirely new enterprise software platforms.
Additionally, the platform integrates seamlessly with Microsoft Teams and SharePoint, fundamentally transforming how remote corporate departments collaborate. You can easily embed a live, fully interactive analytics dashboard directly into a dedicated Teams chat channel. This means your entire marketing or sales department can collectively monitor the real-time success of a brand-new advertising campaign without ever needing to open a separate web browser or log into a completely different software application.
Evaluating the Pros and Cons
Choosing the ultimate business intelligence software requires a highly careful, objective assessment of the platform’s inherent strengths and technical limitations. While this platform boasts an incredibly robust enterprise feature set, IT managers must thoroughly evaluate these factors to ensure the tool aligns perfectly with their operational capabilities.
Advantages
Implementing this powerful analytics suite offers immense operational benefits that drastically improve how corporate teams interact with their massive datasets.
These incredible technological advantages perfectly illustrate why countless global enterprises rely on this data visualization platform daily.
- Exceptional overall cost-efficiency compared to major direct competitors, making enterprise-grade analytics highly accessible to small businesses.
- The incredibly frequent monthly software updates ensure the platform constantly receives brand-new analytical features and critical security patches.
- Massive global community support provides countless free digital tutorials, troubleshooting forums, and customized downloadable dashboard templates.
- Top-tier enterprise security features guarantee that sensitive corporate information remains heavily encrypted and strictly protected against unauthorized access.
Disadvantages
Despite its overwhelming popularity and vast feature set, this complex analytics software does possess a few notable technical and operational limitations.
Potential corporate buyers must carefully evaluate these specific digital drawbacks to ensure the platform completely aligns with their internal technical capabilities.
- The notoriously steep learning curve for mastering DAX formulas can deeply frustrate beginners who lack prior database programming experience.
- The desktop application is restricted to Windows, completely alienating users who rely heavily on Apple Mac computers.
- The user interface can occasionally feel overwhelmingly cluttered and highly unintuitive due to the sheer volume of hidden configuration menus.
- Processing exceptionally massive, multi-gigabyte datasets heavily strains local computer memory, requiring extremely powerful desktop hardware for smooth operation.
Pricing Plans Overview
Budgeting for enterprise-grade analytics requires a highly clear understanding of the diverse subscription tiers offered within this expansive software ecosystem.
Here is a detailed breakdown of the primary billing options currently available to modern businesses of varying sizes.
- Power BI Desktop: A completely free, fully functional application downloaded to your local computer for personal data modeling and report creation.
- Power BI Pro: Costs roughly ten dollars per user per month, widely unlocking cloud publishing, secure dashboard sharing, and active team collaboration.
- Power BI Premium Per User: Priced slightly higher, offering highly advanced artificial intelligence tools, larger model sizes, and more frequent data refreshes.
- Power BI Premium Capacity: Extremely expensive organizational licensing designed exclusively for massive international corporations with thousands of daily active dashboard viewers.
Final Verdict: Is Microsoft Power BI Right for You?
In conclusion, Microsoft Power BI is an extraordinary achievement in the rapidly expanding field of modern business intelligence and data analytics. By successfully combining immensely powerful data-processing mechanisms with highly intuitive visual design tools, it genuinely earns its coveted reputation as a dominant corporate productivity powerhouse. The platform empowers cross-functional teams to collaborate seamlessly, ensuring that critical performance metrics are never hidden in fragmented third-party applications or buried in static, outdated offline spreadsheets.
However, this immense analytical power certainly comes with a remarkably undeniable educational learning curve. Organizations that simply want to make a few basic charts might find the expansive architectural possibilities and the complex DAX coding language highly overwhelming. Yet, for fast-growing businesses, dedicated data analysts, and large corporate teams willing to invest the initial time into properly training their workforce, the long-term strategic rewards are truly outstanding. If your ultimate goal is to significantly streamline data reporting, permanently eliminate manual spreadsheet errors, and unlock the true predictive power of your corporate data, Microsoft Power BI is undeniably one of the absolute best financial investments you can make for your company’s future success.